Local Development Plan: Vision, Objectives & Options
Chapter 8
Housing and Employment Growth Scenarios
8.0 Introduction
This chapter considers the growth needs of the Island over the Plan period. It takes into account the contextual information provided in chapters 3 and 4 and considers how many homes and additional jobs it may be necessary to plan for between 2024 and 2039. The growth scenarios presented will influence how much land is required for residential and employment development over the Plan period. These growth scenarios form the basis of the LDP strategy.
It is important that the need for homes and employment levels are considered collectively to ensure sustainable patterns of development. The initial sections of this chapter consider the existing context and previous trends which should be considered when setting housing and employment targets. The latter sections present the scenarios
8.1 Previous targets (JLDP)
8.1.1 The previous Anglesey and Gwynedd JLDP sought to deliver 7,184 new housing units. This equated to a target of 3,480 new units in Anglesey, representing a rate of 232 dwellings per annum.
8.1.2 However, the annual average indicative requirement of 232 has been met (and exceeded) only 3 times. The total cumulative completions for Anglesey (up to 2024) is 2,697, meaning there is a current shortfall of 551 against the cumulative annual average requirement.
8.1.3 There has been a shortfall in housing provision on sites allocated in the JLDP and a much greater proportion of housing has been delivered on windfall sites compared to what had been anticipated.
8.1.4 The actual average delivery rate over the JLDP period up to 2024 is 193 dwellings per annum.
8.2 Demographic trends
8.2.1 The previous Anglesey and Gwynedd JLDP sought to deliver 7,184 new housing units. This equated to a target of 3,480 new units in Anglesey, representing a rate of 232 dwellings per annum.
8.2.2 The previous Anglesey and Gwynedd JLDP sought to deliver 7,184 new housing units. This equated to a target of 3,480 new units in Anglesey, representing a rate of 232 dwellings per annum.
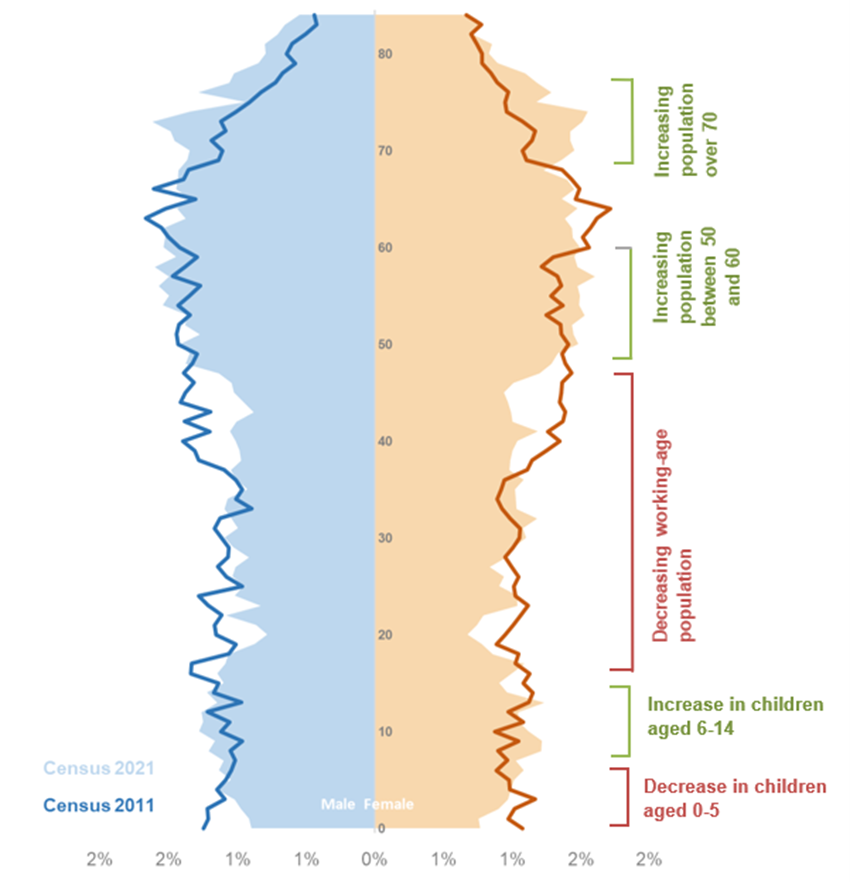
8.2.3 Population change in Anglesey has been driven by a combination of internal migration to and from elsewhere in the UK, and changes to the balance between births and deaths (natural change). The main drivers are a reduction in working-age population (out migration of working age people) and increasing population in older age groups (retirees).
Decline in working age population
8.2.4 Between 2011 and 2021, the working age population (aged between 16 and 64 years) decreased by 8%, or approximately 3,300 people. This was driven by two age groups:
- The number of people aged 35-49 years) decreasing by 17% (from c. 13,300 to 11,000)
- The number of young adults (15-29 years) decreasing by 14% (from c. 11,300 to 9,800)
Increasing population in older age groups
8.2.5 Between 2011 and 2021, there was a 16% increase in population aged 65 years and above, and a 24% increase in population aged 70 years and above.
8.2.6 Collectively, the ageing population creates a strain on services, particularly acute in areas such as the North of the Island. In the long-term, it would undermine the ability of the Island to attract employers if the labour force on which to draw is diminishing.
8.3 Demographic trends
8.3.1 At the 2021 Census, there were an estimated 30,865 economically active people in Anglesey; of these, 1,662 were recorded as unemployed. Just over 26,000 people aged 16+ were classed as ‘economically inactive’.
8.3.2 The latest unemployment estimates from ONS show that following the 2008 recession the unemployment rates in Anglesey remained below the national average, but since 2014 the rate of unemployment in Anglesey has been consistent with the national trend.
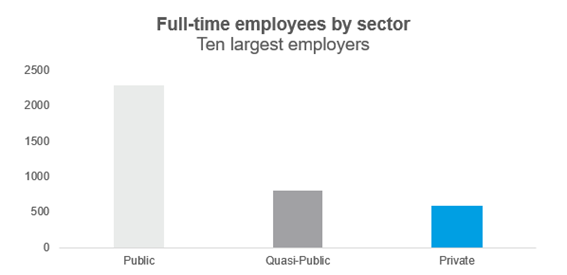
8.3.3 Over the last two decades there have been a series of significant industrial closures, with a loss of over 2,300 direct jobs. This has left an economy with few major private sector employers and a reliance on the public sector. Anglesey is dominated by the seasonal, foundational economy – and in particular tourism, with over 300,000 visitors to the Island at peak times compared to a population of 69,000.
|
Year |
Company |
Jobs Lost |
|---|---|---|
|
2004 |
Octel |
100 to 120 |
|
2008 |
Peboc |
60 |
|
2008 |
Eaton Electrical |
265 |
|
2009 |
Anglesey Aluminum |
300 to 400 |
|
2013 |
Welsh Country Foods |
300 to 350 |
|
2015 |
Wylfa |
300 to 350 |
|
2019 |
Rehau |
100 |
|
2019 |
Marco Cable Management |
40 |
|
2022 |
Orthios |
120 |
|
2023 |
2-Sisters |
730 |
|
Total |
- |
2,315 to 2,535 |
8.3.4 These jobs have not been replaced, leaving behind an economy very reliant on the public sector and public sector contracts (quasi-public), with very few opportunities for progression within the private sector.
8.4 Proposed scenarios
8.4.1 The LDP needs to plan for future housing and employment needs. A suitable way of determining how much growth is likely to occur is by considering employment and population forecasts.
8.4.2 The Council has produced a Local Housing Market Assessment (LHMA), and commissioned analysis and forecasts from Edge Analytics (EA) and from Oxford Economics (OE).
Local Housing Market Assessment (LHMA)
8.4.3 The draft LHMA provides a broad analysis of the Isle of Anglesey Housing Market, considering the long-term requirements for housing on Anglesey. It is currently with the Welsh government for sign off. It covers the period from 2023 – 2028. It is prepared using a standard LHMA toolkit provided by Welsh Government. The LHMA tool analyses housing needs in specific Housing Market Areas (HMAs) in Anglesey. These HMAs are regions where people typically live and move without changing jobs. Anglesey has nine such areas.
8.4.4 The LHMA tool calculates housing need figures for Anglesey based on three household forecast scenarios: Welsh Government Principal, Higher, and Lower projections.
8.4.5 Under the Principal variant the annual housing need for Anglesey is 269 dwellings per annum over the next 5 years. This is split between affordable housing (248 units) and market (21 units). Under the higher scenario the need is 310 dwellings per annum over the next 5 years split between affordable housing (263 units) and market (47 units). Under the lower scenario the need is 236 dwellings per annum over the next 5 years all of which are affordable housing.
8.4.6 The draft LHMA’s preferred projection is the principal variant. There was significant favour towards adopting the higher variant in consultation on the LHMA but taking into account the population decrease between 2011 and 2021 the principal variant was considered the most appropriate selection.
8.4.7 The draft LHMA identifies that there is a significant issue with affordability on the Island. Average house prices are over 7 times the average income. A combination of low wages and high house prices, that have been further driven up by in migration, is resulting in a distorted housing market where the LHMA proposes that 89% of housing provision should be affordable housing. It is not clear how such a high proportion of affordable housing could be funded.
8.4.8 If higher market housing growth were to be pursued, this could potentially result in:
- Improved affordability of market housing (to buy and to rent), and
- Increased viability of delivery of affordable housing (i.e. subsidised housing)
The Standard Method
8.4.9 There is no simple answer as to what level of market housing growth would support affordable housing delivery. In England, housing need is calculated using the “Standard Method” which sets housing need linked with the affordability of housing in the local area.
8.4.10 The government prescribed formula that local planning authorities in England must use to identify their minimum annual local housing need is set out in national planning guidance and linked to the National Planning Policy Framework.
8.4.11 The method is a policy off, unconstrained calculation. It identifies need, not the final housing requirement (which can differ following planning judgments, constraints, and opportunities such employment growth).
8.4.12 The starting point is a “Baseline Need” of 0.8% of the existing housing stock. There is then an affordability adjustment based on a five-year average of median house prices to incomes. For each 1% the affordability ratio exceeds 4, the baseline is increased by 0.95 (95%). This is then the minimum annual housing need.
8.4.13 Applying this formula to Anglesey, the Baseline Need would be 280 units, and the affordability adjustment would be around 1.4, taking total need to around 390 dwellings per annum, or 5,850 over the Plan period. The methodology clearly only applies in England, but it provides a helpful benchmark as to the level of housing delivery that the UK Government thinks would be needed given Anglesey’s relative (un)affordability.
Edge Analytics scenarios
8.4.14 EA has generated a number of scenarios to assess likely population and household growth. These do not explicitly include an employment-led scenario or one that considers the affordability of housing. They do however make a series of labour market assumptions. The scenarios are:
| Scenario | Description |
|---|---|
| WG-2018 | Replicates the WG 2018-based principal projection (2018 base year) |
| WG-2018 (rebased) | Replicates the WG 2018-based principal projection, rebased to the 2023 MYE and WG household estimate, with the original trend continuing thereafter. |
| Trend-5yr | Migration assumptions calibrated from a 5-year historical period (2018/19–2022/23), including the UPC adjustment in the international migration component of the MYE (2001/02–2020/21). Scenario has a base year of 2023. |
| Trend-15yr | Migration assumptions calibrated from a 15-year historical period (2008/09–2022/23), including the UPC adjustment in the international migration component of the MYE (2001/02–2020/21). Scenario has a base year of 2023. |
| Dwelling-led-5yr | Models the population growth impact of average annual dwelling growth of +154 dpa, based on a 5-year history of dwelling completions (2019/20–2023/24). Migration assumptions are aligned with the Trend-5yr scenario. |
| Dwelling-led-15yr | Models the population growth impact of average annual dwelling growth of +121 dpa, based on a 15-year history of dwelling completions (2009/10–2023/24). Migration assumptions are aligned with the Trend-5yr scenario. |
8.4.15 The analysis identifies key 2011-2021 trends of a decline in population (versus growth nationally) and an ageing population. It also identifies that prior to the 2021 Census, mid-year estimates (MYE) overestimated population growth. The MYEs were rebased in 2023 (i.e. retrofitted) to match the actual 2021 Census results.
8.4.16 The rebased MYEs show that:
- There was an increase in internal migration since 2019 driven by inflow from Cheshire West, Chester, and Liverpool
- This drove (estimated) population growth from 2019 – births consistently lower than deaths so otherwise would be seeing natural decline
- International migration has limited impact on Anglesey
8.4.17 The official Welsh Government population (and household) projections are based on pre-2021 MYEs (so have an incorrect starting point) and assume a birth rate that is too high (2.0 in 2018 increasing to 2.1 by 2043 whereas the recorded rate was 1.43 in 2023).
8.4.18 The EA work therefore identifies a need for bespoke modelled scenarios. Their scenarios include the following assumptions:
- Fixed out-commuting from Anglesey
- Fixed 3.8% unemployment rate
- Labour force growth (except for Trend-15yr) due to growth in older age groups continuing to work
8.4.19 EA acknowledges that these may not hold in the face of significant employment or labour market changes.
8.4.20 The scenarios have the following population growth outcomes:
| Change 2024–2039 | Average per year 2024–2039 | |||
|---|---|---|---|---|
| Population Change | Population % Change | Net Migration | Natural Change | |
| Dwelling-led-5yr | 2,726 | 3.9% | 619 | -437 |
| Dwelling-led-15yr | 1,661 | 2.4% | 551 | -441 |
| Trend-5yr | 1,156 | 1.7% | 518 | -441 |
| WG-2018 (rebased) | -342 | -0.5% | 311 | -334 |
| WG-2018 (rebased) | -376 | -0.5% | 309 | -334 |
| Trend-15yr | -1,094 | -1.6% | 333 | -406 |
8.4.21 The six scenarios do not explicitly include an employment-led scenario or one that considers the affordability of housing. They do however, make a series of labour market assumptions.
8.4.22 The table below sets out the annual average dwelling growth under the various scenarios.
| Change 2024-2039 | Annual Average Dwelling Growth | ||
|---|---|---|---|
| Households Change | Households % Change | ||
| Dwelling-led-5yr | 2,145 | 6.8% | 154 |
| Dwelling-led-15yr | 1,683 | 5.4% | 121 |
| Trend-5yr | 1,467 | 4.7% | 105 |
| WG-2018 | 469 | 1.5% | 34 |
| WG-2018 (rebased) | 463 | 1.5% | 33 |
| Trend-15yr | 226 | 0.7% | 16 |
Oxford Economics scenarios
8.4.23 The OE forecasts are based on employment and assumptions about how the labour market responds, including changes in commuting patterns and employment rates, but are not explicitly linked to housing delivery.
8.4.24 The following table sets out the growth scenarios from OE. These are employment-led, and the model assumes that the labour market (employment rates and commuting patterns) and migration both respond to the increase in jobs.
8.4.25 Scenario A includes an additional 4,500 jobs added as an input to the model in 2039 to account for new jobs within the Freeport. These are all permanent jobs. These then generate a further 3,200 jobs through the supply chain and employment multiplier impacts.
8.4.26 Scenario B includes an additional 7,600 jobs added as an input to the model in 2039 to account for new jobs within the Freeport and at Wylfa. These then generate a further 5,000 jobs through the supply chain and employment multiplier impacts. However, these are not all permanent jobs – there are 3,000 temporary construction jobs in there associated with Wylfa in 2039. By the time construction has finished (in 2045, beyond the Plan period) there are an additional 5,200 permanent jobs. The OE forecasts are “unconstrained” in that they do not assume there is crowding out from competition for workers. The increase in jobs drives changes in commuting patterns, employment rates and population (in-migration).
|
IACC |
2025 |
2039 |
Change |
% change |
|---|---|---|---|---|
|
Baseline |
- |
- |
- |
- |
|
Jobs |
25,903 |
27,595 |
1,691 |
6.53% |
|
Out-commuting |
4,961 |
5,447 |
486 |
9.90% |
|
Employment rate |
50.65% |
51.83% |
1.18% |
2.32% |
|
Population |
69,463 |
72,531 |
3,069 |
4.42% |
|
- |
- |
- |
- |
- |
|
Scenario A |
- |
- |
- |
- |
|
Jobs |
- |
35,280 |
9,376 |
36.20% |
|
Out-commuting |
- |
3,858 |
-1,103 |
-22.23% |
|
Employment rate |
- |
57.68% |
7.03% |
13.88% |
|
Population |
- |
76,875 |
7,412 |
10.67% |
|
- |
- |
- |
- |
- |
|
Scenario B |
- |
- |
- |
- |
|
Jobs |
- |
40,160 |
14,256 |
55.04% |
|
Out-commuting |
- |
2,841 |
-2,120 |
-42.74% |
|
Employment rate |
- |
60.43% |
9.77% |
19.29% |
|
Population |
- |
80,461 |
10.998 |
15.83% |
The Scenarios
8.4.27 The growth scenarios below consider demographics, past trends, policy factors and the relationship between housing and the local economy. Some also take into account large-scale interventions at Wylfa, and the Freeport designation. All scenarios have a 2039 forecast horizon.
|
Scenario No. |
Scenario Name |
Annual average employment growth |
Dwellings Per Annum |
Total Number of Dwellings (2024-2039) |
|---|---|---|---|---|
|
1 |
LHMA identified needs |
X |
269 |
4,035 |
|
2 |
“Standard Method” |
X |
390 |
5,850 |
|
3 |
Dwelling-led 5 year |
98 |
154 |
2,310 |
|
4 |
Dwelling-led 15 year |
66 |
121 |
1,815 |
|
5 |
Trend 5 year |
49 |
105 |
1,575 |
|
6 |
WG - 2018 |
2 |
34 |
510 |
|
7 |
WG (rebased) |
-0.4 |
33 |
495 |
|
8 |
Trend 15 year |
2 |
16 |
240 |
|
9 |
OE Baseline |
113 |
100 |
1,500 |
|
10 |
Freeport |
106 |
239 |
3,585 |
|
11 |
Freeport & Wylfa |
588 |
356 |
5,340 |
8.4.28 There is significant variance across the scenarios presented above. Neither the EA nor the OE work makes any assumptions about, or assessment of, the affordability for local residents and workers.
8.4.29 The EA forecasts have lower employment growth but higher household growth. The higher household growth is because the EA work takes account of housing demand from an ageing population that has an increasing number of single-person households. The OE model does not do that – it assumes an average household size of 2.21.
8.4.30 Trend based scenarios are unlikely to change Anglesey’s recent trajectory of natural change reducing the population, out-migration of prime working age people, in-migration of retirees and increasingly unaffordable housing.
8.4.31 Developments at Wylfa and the Freeport provide seismic opportunities for the Island to buck recent negative demographic and employment trends by providing local jobs. However, these opportunities must be considered alongside the risks that without proper planning and management of the impacts, they could exacerbate issues of affordability.
8.4.32 There is a need for the LDP to appropriately respond to and capitalise on the opportunities provided by Wylfa and the Freeport. This includes recognising that a “business as usual” trajectory based on recent trends is unlikely to be the most appropriate future scenario for the LDP.
8.4.33 Planning for significantly higher growth would also assist in tackling the issue of affordability. Affordability issues have partly arisen due to insufficient supply of housing. More market homes would mean more homes that are available to residents, with a positive impact on affordability due to increased supply. The challenge of affordability is arguably even more pressing in a situation where there is significant potential for employment and therefore population growth on Anglesey through the Freeport and the announcement of development at Wylfa.
8.4.34 The ability of residents to buy and rent housing locally is key in retaining the benefits of increased employment – if not, even with new employment opportunities, prospective workers may choose to commute from a more affordable location and therefore spend their incomes elsewhere.
8.4.35 Planning for higher growth in the LDP would also ensure that growth which is likely to happen irrespective of the LDP is properly planned, sustainably located and maximises the benefits to be leveraged from these developments.
8.5 Supply considerations
8.5.1 Having considered the unconstrained needs of the area, it is important to also consider the potential supply and any other factors which may constrain delivery that ought to be considered in setting a realistic and deliverable growth target.
Future Supply
8.5.1 A number of different sources are expected to contribute to the housing supply to deliver the new Anglesey LDP. These can be summarised as follows:
Completions – dwellings completed since the start of the new LDP period (from 1st April 2024).
Commitments – dwellings with existing planning permission anticipated to be completed over the new LDP period. This includes sites with planning permission that have either commenced or that are not yet started (but where development is expected to begin).
Windfall allowance – unallocated sites which are anticipated to be developed over the new LDP period on small and large sites. Past trends of delivery will support the contribution these sites can make to the housing supply.
New Housing Allocations – sites to be allocated for residential development in the new LDP.
8.5.2 With regards to commitments and new housing allocations the Council will need to estimate lead in times (from permission to delivery) and build out rates (how many houses will be completed per year). The Council will assess past lead in and build out rates on large sites to evidence assumptions on how future commitments and allocations may be delivered.
8.5.3 The Council will also evaluate how windfall developments (e.g. unallocated sites) will deliver housing in the new Plan period. This will include assessing past windfall development rates, including location and type of housing delivered.
Call for Sites
8.5.4 A call for sites was held between 12th May 2025 and 4th August 2025. Site proposers were invited to suggest land which may be suitable for a range of uses. The Council will publish the candidate site register alongside the Preferred Strategy.
Environmental constraints and other considerations
8.5.5 The LDP will also consider other factors that may determine what levels of growth are achievable, including environmental constraints, social and physical infrastructure capacity, the role and function of places, the viability of sites, levels of affordable housing need.
8.5.6 The physical environmental constraints to development within the Plan area which need to be considered as part of the growth and spatial distribution of housing in the Plan area include:
- Anglesey National Landscape – which washes over most of the Island’s coastline.
- International designations including Special Areas of Conservation (SAC), Special Protection Areas (SPA) and RAMSAR sites.
- National designations including Sites of Special Scientific Interest (SSSI), National Nature Reserves (NNR) and historic landscapes such as Conservation Areas.
- Locally important landscapes including Special Landscape Areas (SLA).
- Areas at risk of flooding – several parts of the Plan area including parts of settlements are at risk of flooding.